A phase-analysis method reveals mid-infrared polaritons inside atomically thin silver dots too small to show a complete wave pattern.
(Nanowerk Spotlight) Infrared light is useful for sensing chemicals, reading heat, and probing material vibrations, but it comes with a size problem. Its wavelengths are measured in micrometers, while many modern electronic and photonic structures are built at nanometer scales. That means the light can be hundreds or thousands of times wider than the features it needs to interact with.
To get around that mismatch, researchers do not force ordinary infrared light into tiny spaces. They use waves that form when infrared light interacts with electrons or atomic vibrations in a material. These hybrid waves, called polaritons, can have much shorter wavelengths than infrared light traveling through open space because the material is not just a passive surface. Its electrons or atoms move along with the infrared field.
Because the infrared field and the material’s motion are linked, the wave can go from one crest to the next over a much shorter distance than ordinary infrared light can. That shorter crest-to-crest distance is the polariton’s smaller wavelength. But this compression creates another problem. The polariton wave can be squeezed in even smaller space if one can capture it (confine) in small volume of a quantum dot. Waves are usually measured by watching them repeat. If a polariton is trapped inside a dot smaller than one repeat length, there is not enough space for the repeating fringe pattern to fully appear.
A recent paper in Advanced Materials (“Ultra-Confinement of Polaritons in Single Atomic Layer Ag Photonic Quantum Dots”) addresses that problem of seeing polaritons confined in nanodots made from atomically thin silver and graphene, using a phase-analysis method that reads hidden wave information from near-field optical data. The study uses an atomically thin silver layer inside a larger material stack to confine mid-infrared surface polaritons.
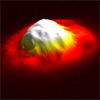
Surface polariton waves revealed by eikonal analysis. (a) Schematics of sSNOM imaging of the SiC/2D-Ag/EG nano-disks. (b) The AFM topography image; the raw maps of (c) third demodulated harmonic sSNOM optical amplitude, Abs(S3), and (d) optical phase, Arg(S3). (e,f) Argand plot: cross-correlation between Re(S3) and Im(S3) signals (purple dots in (e) are taken along a fixed angular direction in real space image). (f,g) Correlation between the selected cluster points in Argand space with the same in the spatial map of Abs(S3). Scale bars are 100 nm. (Image: Reproduced from DOI:10.1002/adma.202521015, CC BY) (click on image to enlarge)
The device had to do two jobs at once: create a surface wave and confine it inside a nanoscale shape. To do that, the researchers built a layered stack from silicon carbide, atomically thin silver, and epitaxial graphene. The silver sits between the silicon carbide substrate and the graphene cap, forming a stack held together by van der Waals forces, the weak attractions that bind many 2D materials.
Each part of the stack plays a different role. Silicon carbide provides the vibrating atomic lattice that couples strongly to mid-infrared light. Near its Reststrahlen band, a spectral region where lattice vibrations dominate infrared behavior, it can support surface phonon polaritons. The silver and graphene layer gives researchers a region they can shape into a dot, creating a small boundary that confines the surface wave sideways.
Together, the atomically thin silver and epitaxial graphene form the 2D-Ag/EG region. Lithography shaped that region into circular photonic dots smaller than 1 µm. The main dot analyzed in the study measured about 500 nm across. At that size, the dot can hold a compressed surface wave, but it is too small to show the full repeating fringe pattern that researchers usually use to measure that wave.
To look for the confined polariton anyway, the researchers used scattering-type scanning near-field optical microscopy (sSNOM). A sharp probe samples the optical field close to the surface and records both amplitude and phase. Those data can reveal polaritons in larger structures by showing bright and dark fringes. In this dot, however, the real-space image captured only part of the wave’s phase change, not a complete repeat.
The raw data still held the information needed to measure the wave, but it was mixed with other signals. Different parts of the material stack produced different optical backgrounds. A narrow oxidized silver belt at the dot edge added another region between the silver-containing center and the surrounding silicon carbide substrate. The challenge was to separate the moving wave from those background changes without relying on visible fringes.
The new analysis treated the complex near-field signal as a phase trajectory. The sSNOM signal is complex: it contains two components, one real and one imaginary, that can be plotted as coordinates. As the polariton phase advances across the dot, that complex signal rotates. When plotted this way, in what mathematicians call an Argand plane, the changing signal follows an arc.
To turn those arcs into numbers, the researchers used an eikonal model, which tracks how a wave’s phase changes from one position to the next. By fitting each arc, they found its center, which supplied the background response for that material region. Once that background was removed, the remaining arc showed how the polariton phase changed across the dot. The change of phase with distance then gave the local wavevector.
This changes what researchers need in order to measure the wave. The method does not need a full standing-wave pattern or a field of view larger than the polariton wavelength. It extracts phase evolution over a fraction of a cycle. The analysis can therefore work at the scale of the nanostructure, instead of requiring a larger structure just to make the wavelength visible.
At the dot edge, the oxidized silver belt gave the method a built-in test. The central 2D-Ag region, the oxide belt, and the surrounding silicon carbide substrate produced separate arcs with different centers and radii, the signatures of different backgrounds and wave amplitude. The raw maps could not cleanly identify those material boundaries because wave and background contributions overlapped.
The size of the confined wave and the strength of the fitted near-field signal are separate results. The analyzed dot had a radius of about 250 nm, compared with a free-space wavelength near 10 µm, which corresponds to a reported lateral confinement of about λ/40. The measured polariton wavelength showed that the wave was also tightly confined vertically, staying close to the surface with a confinement factor of about λ/50.
At 994 cm⁻¹, the fitted sSNOM signal magnitude in the dot center was more than 700 times higher than the signal from the surrounding silicon carbide substrate. The paper treats this as evidence of strong confinement, not as a universal device-level enhancement factor. That distinction matters because the number comes from the fitted near-field signal, not from a finished photonic component.
Measurements across the infrared frequency range supported the interpretation. From 963 to 1040 cm⁻¹, the measured polariton wavevector changed in ways associated with the silicon carbide Reststrahlen band. The fitted background response also changed with frequency. That connection ties the confined mode to the vibration-dominated infrared response of silicon carbide, rather than only to the dot’s shape or edge contrast.
An approach designed for cases without visible fringes still needs a benchmark where fringes exist. The study therefore tested the eikonal analysis on larger hexagonal boron nitride structures. In that setting, conventional fringe counting can still recover polariton wavelengths. The new method produced dispersion values in good agreement with theory while using a smaller local region.
That benchmark strengthens the case for applying the method to the silver dots, where the dot is too small for ordinary fringe analysis. It also places the work alongside related efforts to squeeze infrared light with polaritons and increase polariton density by trapping polaritons in engineered quantum boxes. This paper adds a local measurement strategy for smaller infrared structures.
The advance is not a finished photonic device. Its value is more specific: it shows that researchers can measure a polariton inside a structure too small to show a complete fringe pattern. That ability is necessary for designing nanophotonic systems smaller than the waves they control.
For authors and communications departmentsclick to open
Lay summary
Prefilled posts
Nanowerk Newsletter
Get our Nanotechnology Spotlight updates to your inbox!
Thank you!
You have successfully joined our subscriber list.
Become a Spotlight guest author! Join our large and growing group of guest contributors. Have you just published a scientific paper or have other exciting developments to share with the nanotechnology community? Here is how to publish on nanowerk.com.